Riding Distribution – Guess who wins?

Consider the following facts:

The smallest ridings in Canada (by eligible voters) are:
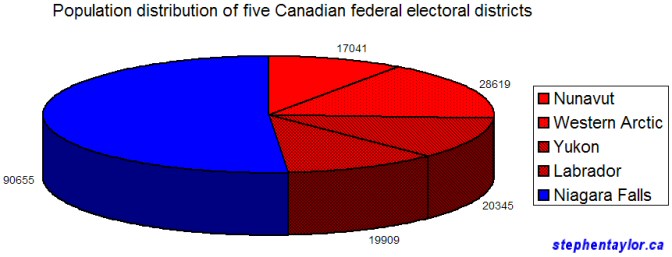
Nunavut – 17,041
Labrador – 19,909
Yukon – 20,345
Malpeque – 26,010
Cardigan – 27,656
Egmont – 27,545
Charlottetown – 27,829
Western Arctic – 28,619

These seats are all held by Liberals.

Now, consider a large riding, such as the one won by Rob Nicholson of the Conservative Party:
Niagara Falls – 90,655

There are a few facts that we can derive from this data.

1) The northern ridings of Nunavut, Western Arctic, Yukon and Labrador (total voters: 85914 is still smaller than the riding of Niagara Falls. These four Liberal seats represent less of the population than the one Conservative MP. Perhaps the north should be one seat?
five-electoral-districts.jpg

2) The other ridings above (from Prince Edward Island) total 109,040 people and thus total too large a population for a single riding. While splitting the province into two ridings would create two ridings totaling 54,520 people each. However this number is still below the average riding size of 72,944 people. The three smallest PEI ridings could amalgamate to form a riding of 81,211 people.

3) These 8 small ridings (my arbitrary cutoff was 30,000 people) represent a total population of 194,954 people or 2.67x the average riding population (ie. just shy of 3 “real” seats). Meanwhile these tiny ridings represent 8 Liberal votes.
The price of gas

Gas prices are hitting record dollar amounts (if you ignore inflation). But, while you know that the government makes up a large portion of the pump cost, you may not realize how much (I didn’t).

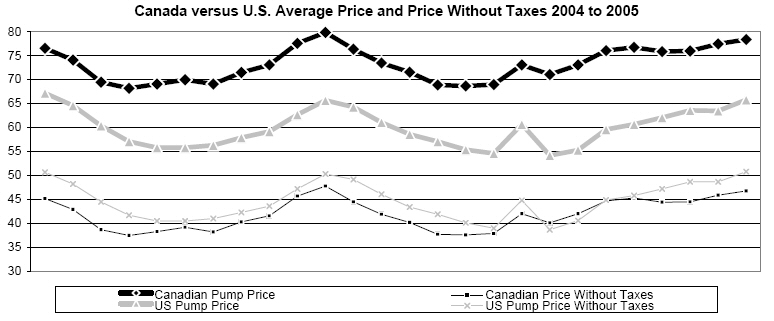
Here is the average cost of gas from May 2004 – April 2005 in Canada and in the United States. The chart also compares the prices with the taxes stripped. As one can discern from the graph, the Canadian cost (minus taxes) is actually somewhat lower than the US. I’d guess that this is because we’re a larger oil producer than the U.S. However, we pay higher at the pumps because of taxes.

canada-us-gas-prices.jpg
Source: Canadian Taxpayers Federation

How does our tax situation compare? Well, if you’re a Canadian, you already know your taxes are higher than what an American pays. But, by how much?

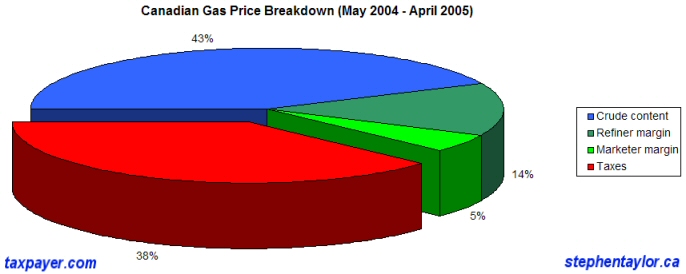
This graph represents the price breakdown of the price of gasoline at the pump for the Canadian consumer in between the same time period:

canadian-gas-prices.jpg

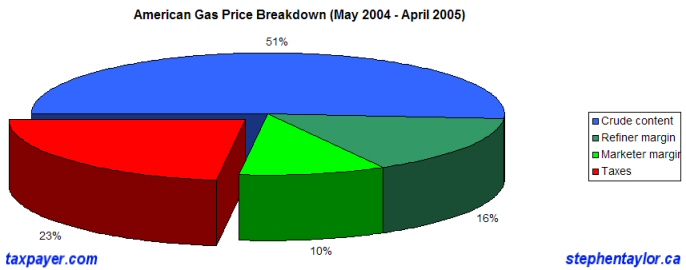
Here’s the comparative American graph:

american-gas-prices.jpg

A full 38% of the price that we pay at the pump goes to the taxman while American only suffer 23%.

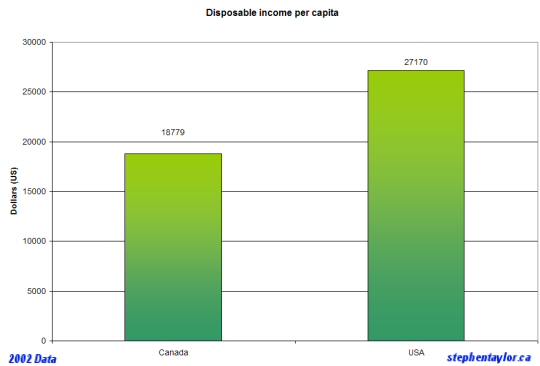
And now for a correlative comparison (and while not the absolute and certain truth of cause and effect, it may provide some insight).

disposable-income-canada-usa.jpg

The price of gas is tied into the cost of living. Virtually every physical product we buy (whether food, furniture, home electronics etc.) is delivered by truck and figures into the price we pay. Air Canada raised its ticket prices as a reaction to the soaring cost of fuel. The daily commute to the office is becoming a significant expense.

Would it be in the government’s best interest to reduce taxes on the price of fuel to stop knee-capping the economy?