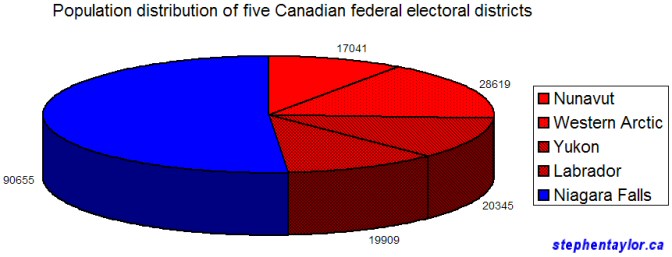
Consider the following facts:
The smallest ridings in Canada (by eligible voters) are:
Nunavut – 17,041
Labrador – 19,909
Yukon – 20,345
Malpeque – 26,010
Cardigan – 27,656
Egmont – 27,545
Charlottetown – 27,829
Western Arctic – 28,619
These seats are all held by Liberals.
Now, consider a large riding, such as the one won by Rob Nicholson of the Conservative Party:
Niagara Falls – 90,655
There are a few facts that we can derive from this data.
1) The northern ridings of Nunavut, Western Arctic, Yukon and Labrador (total voters: 85914 is still smaller than the riding of Niagara Falls. These four Liberal seats represent less of the population than the one Conservative MP. Perhaps the north should be one seat?

2) The other ridings above (from Prince Edward Island) total 109,040 people and thus total too large a population for a single riding. While splitting the province into two ridings would create two ridings totaling 54,520 people each. However this number is still below the average riding size of 72,944 people. The three smallest PEI ridings could amalgamate to form a riding of 81,211 people.
3) These 8 small ridings (my arbitrary cutoff was 30,000 people) represent a total population of 194,954 people or 2.67x the average riding population (ie. just shy of 3 “real” seats). Meanwhile these tiny ridings represent 8 Liberal votes.