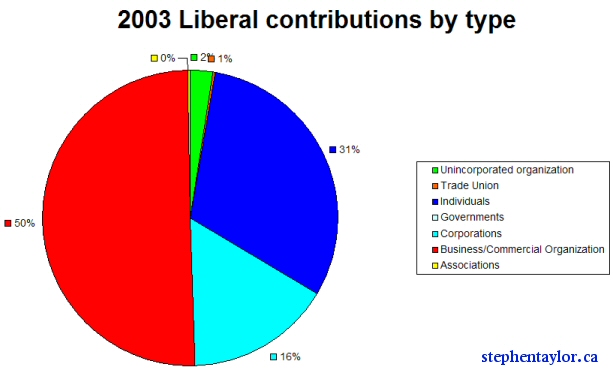
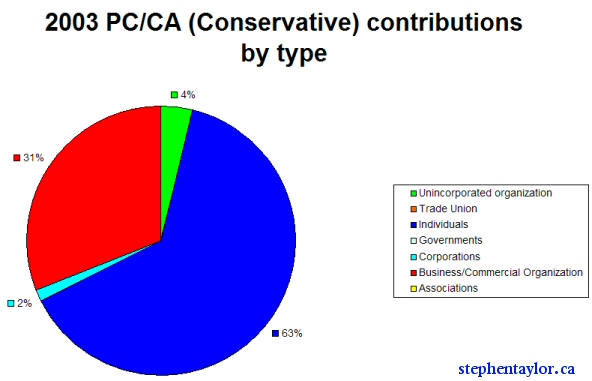
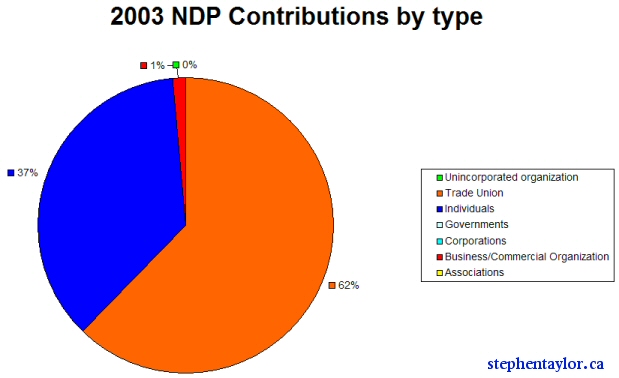
Inspired by the last two posts, I decided to look at all of the raw data from 2003. I downloaded the total contributions per party into spreadsheet form, sorted the data by contributor type, summed each contributor type and then graphed each contributor type into pie-chart form (to view percentages).
It was suggested that the Liberals are “Corporate whores” by Mike Jones. Let’s take a look…

The Liberals rack up 16% contributions from corporations. Not too whore-ish, yet nothing to be too proud of. A full 50% of their contributions come from businesses (not “big business”).
Ok, let’s take a look at the Conservatives…

Wow, the Conservatives only take 2% of their total contributions from Corporations. Thus, corporate whores we are not! Even small-medium businesses do not make up as great of a percentage as this contributor type does on the Liberal chart (ie. 31% Conservative vs. 50% Liberal). The bulk, and I do mean bulk of contributions to the Conservatives in 2003 were made by individuals like you and me (63%). I would argue that this figure most accurately represents the ‘purity’ of a party as the Conservatives truly represent the electorate.
Let’s take a look at the NDP…

A whopping 62% of NDP contributions come from trade unions! “Union whores” perhaps? “Big Labour” and “Big Unions” are definately at the controls of the NDP! The only redeeming aspect is that the NDP has a greater proportion of contributions from individuals than the Liberals. However, the proportion of contributions from individuals is less than half of the parallel proportion of the Conservatives (31% NDP, 63% Conservatives).
The next time that someone tells you that the Conservatives are controlled by the corporations, show them these figures. Tell them to take a closer look.
That should settle the debate.
(Aside – the total amounts collected by party in 2003 were Liberal: $21,811,746.65, CA/PC (Conservative): $7,725,072.51, and NDP: $7,761,588.18)