Mark Carney helped write the playbook that just sank Keir Starmer
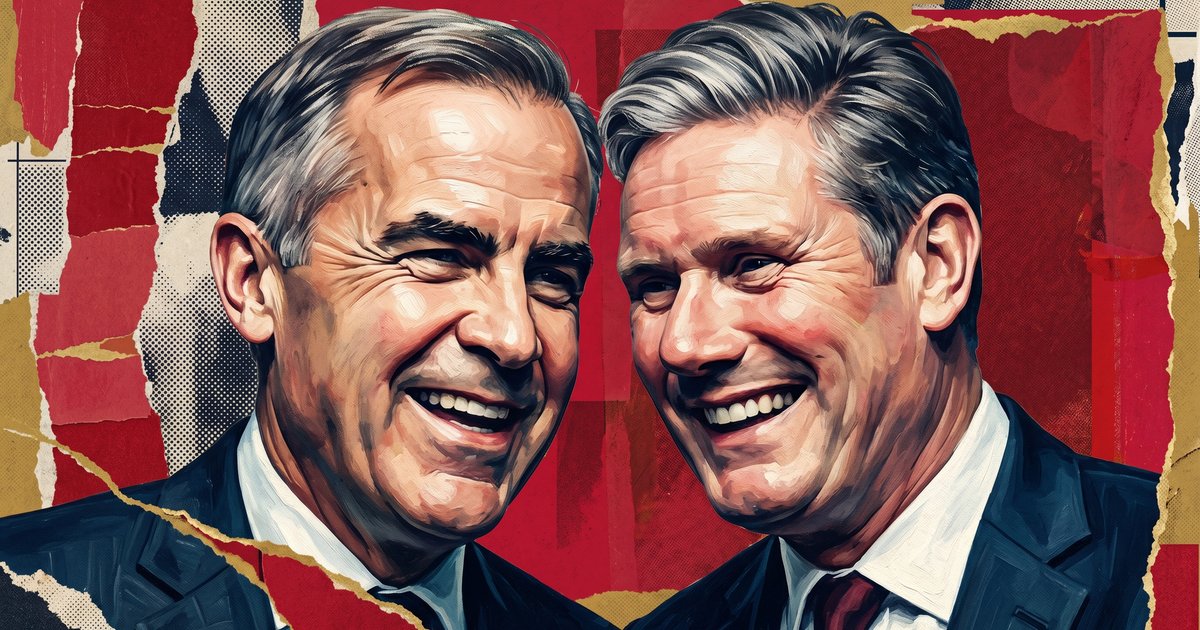
Keir Starmer resigned as British prime minister on June 22, the worst-polling Labour leader on record, undone by a program of tax rises, paternalism, and managed decline. Mark Carney endorsed the chancellor who built that program, sat on the task force that delivered its…